The Mapping Problem
But O-Ring Failures May Scale as Well

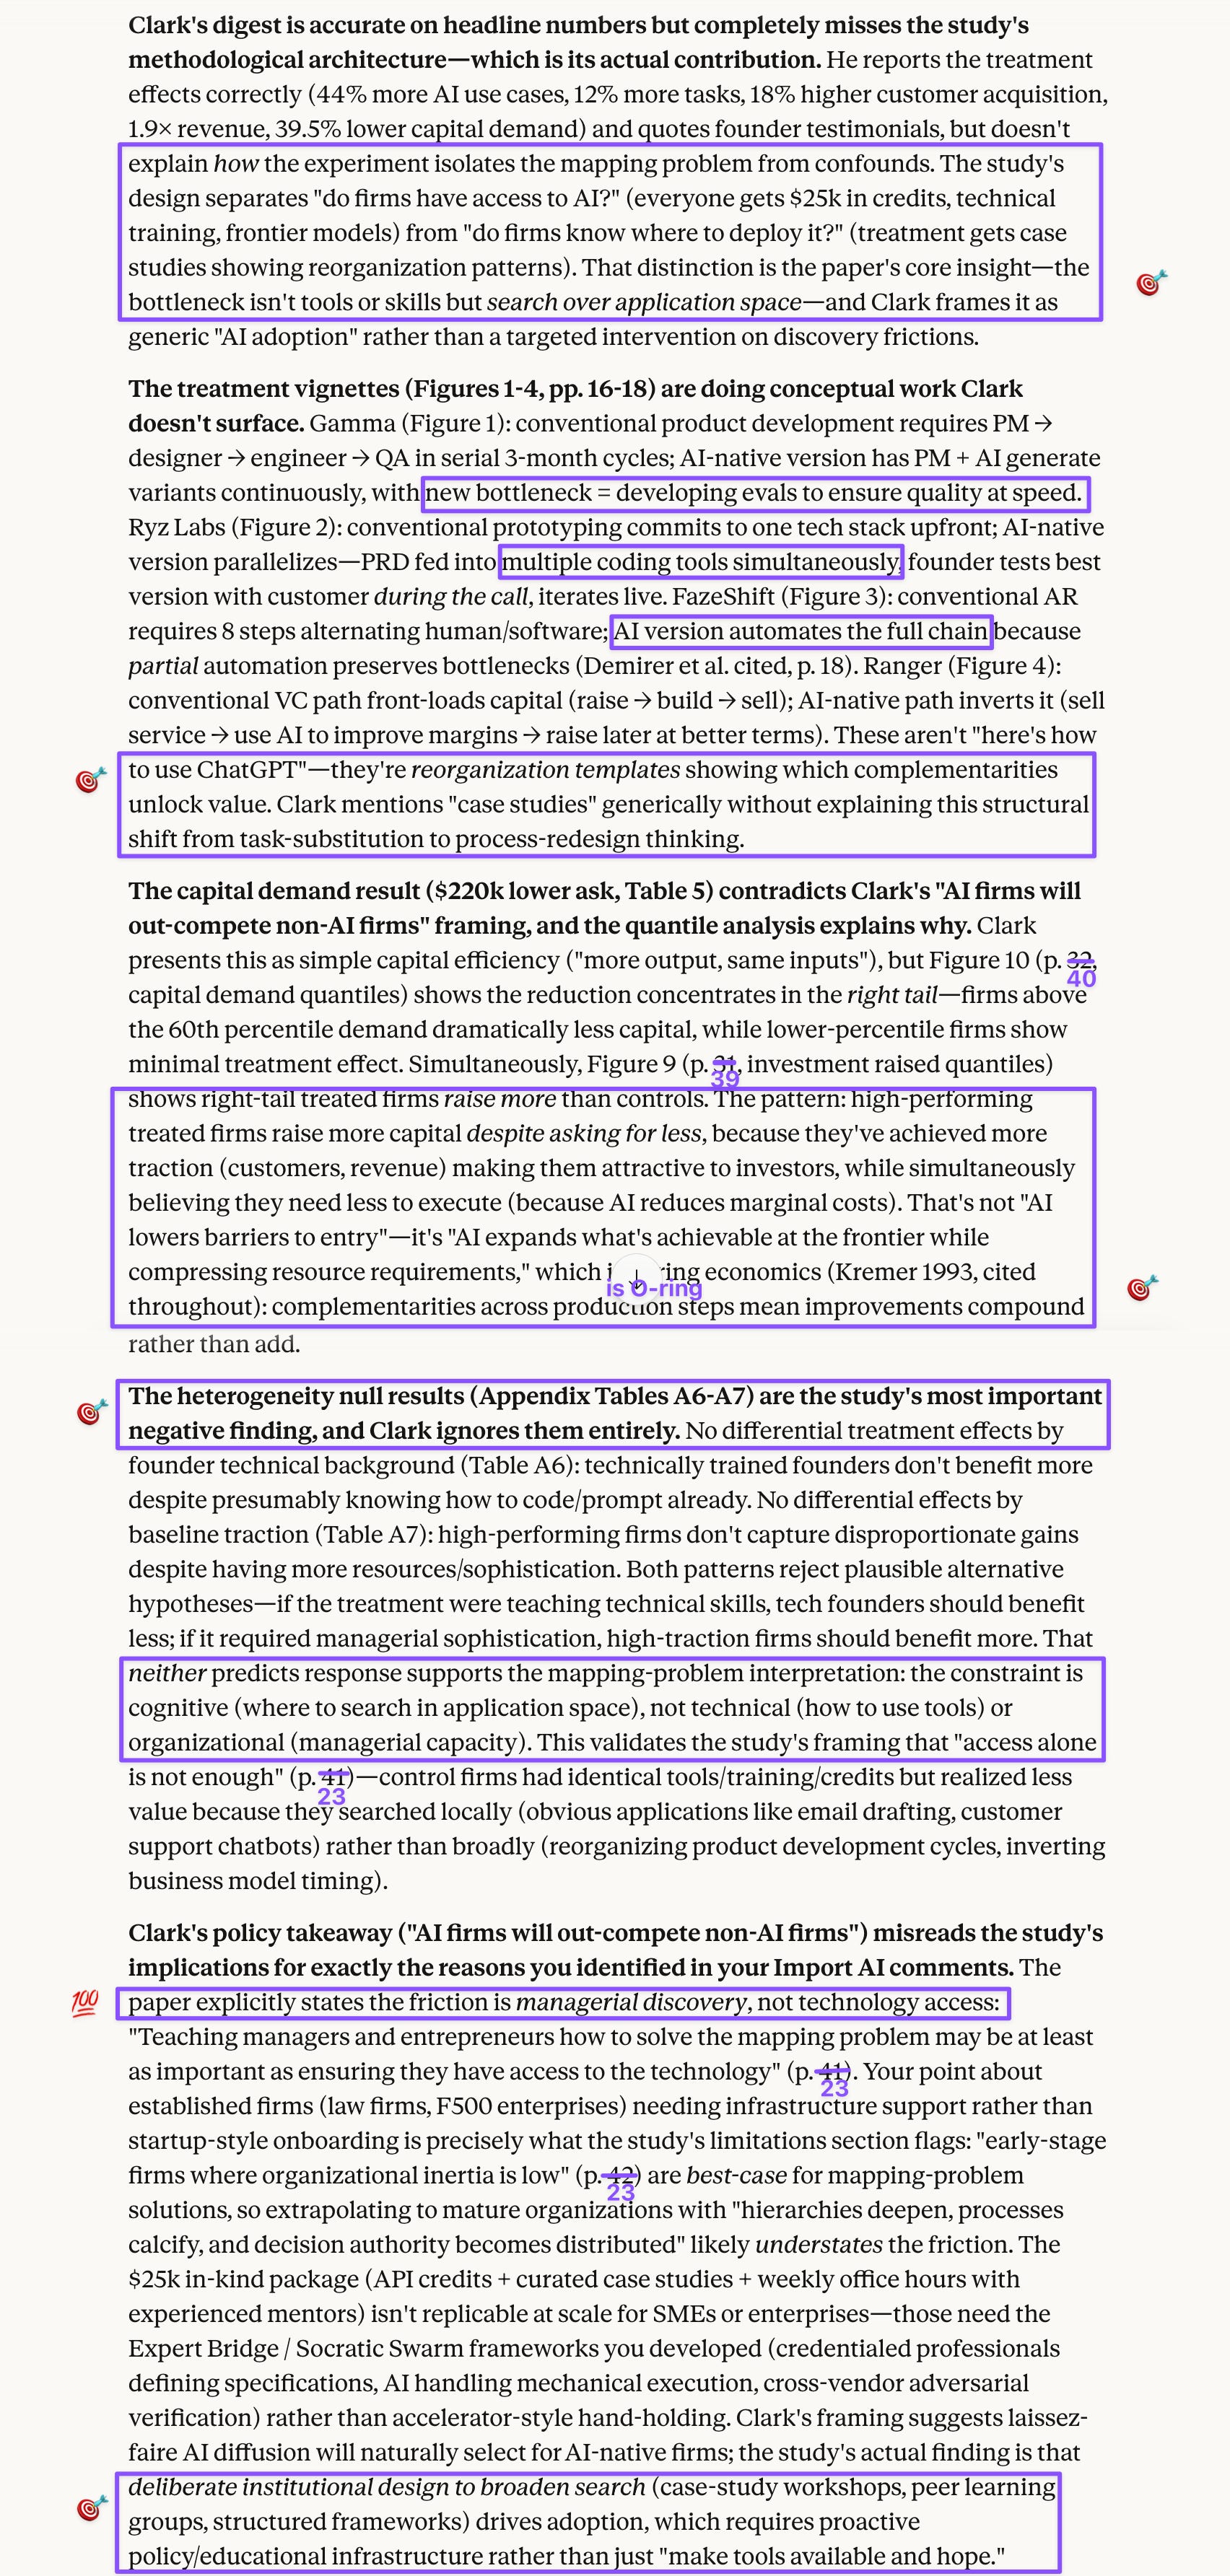
Clark’s coverage of the Mapping Problem hits the headline numbers accurately but misses the study’s actual contribution entirely. The bottleneck isn’t AI access or technical skill: the $25k in-kind package (API credits, partner tools, interactive sessions) went to both control and treated firms equally, as did weekly technical training sessions. The treatment was informational: case study workshops showing reorganization patterns and optional masterclasses with AI-native founders. That isolation is the methodological core of the study, which separates technology access from managerial discovery. The null heterogeneity results (no differential gains by founder technical background or by baseline traction) validate this framing: the constraint is cognitive, not technical. Firms with identical tools searched locally (drafting, customer support chatbots) while treated firms searched broadly (reorganizing product development cycles, inverting business model timing). Clark frames this as generic AI adoption, when the study is in fact a targeted intervention on discovery friction.
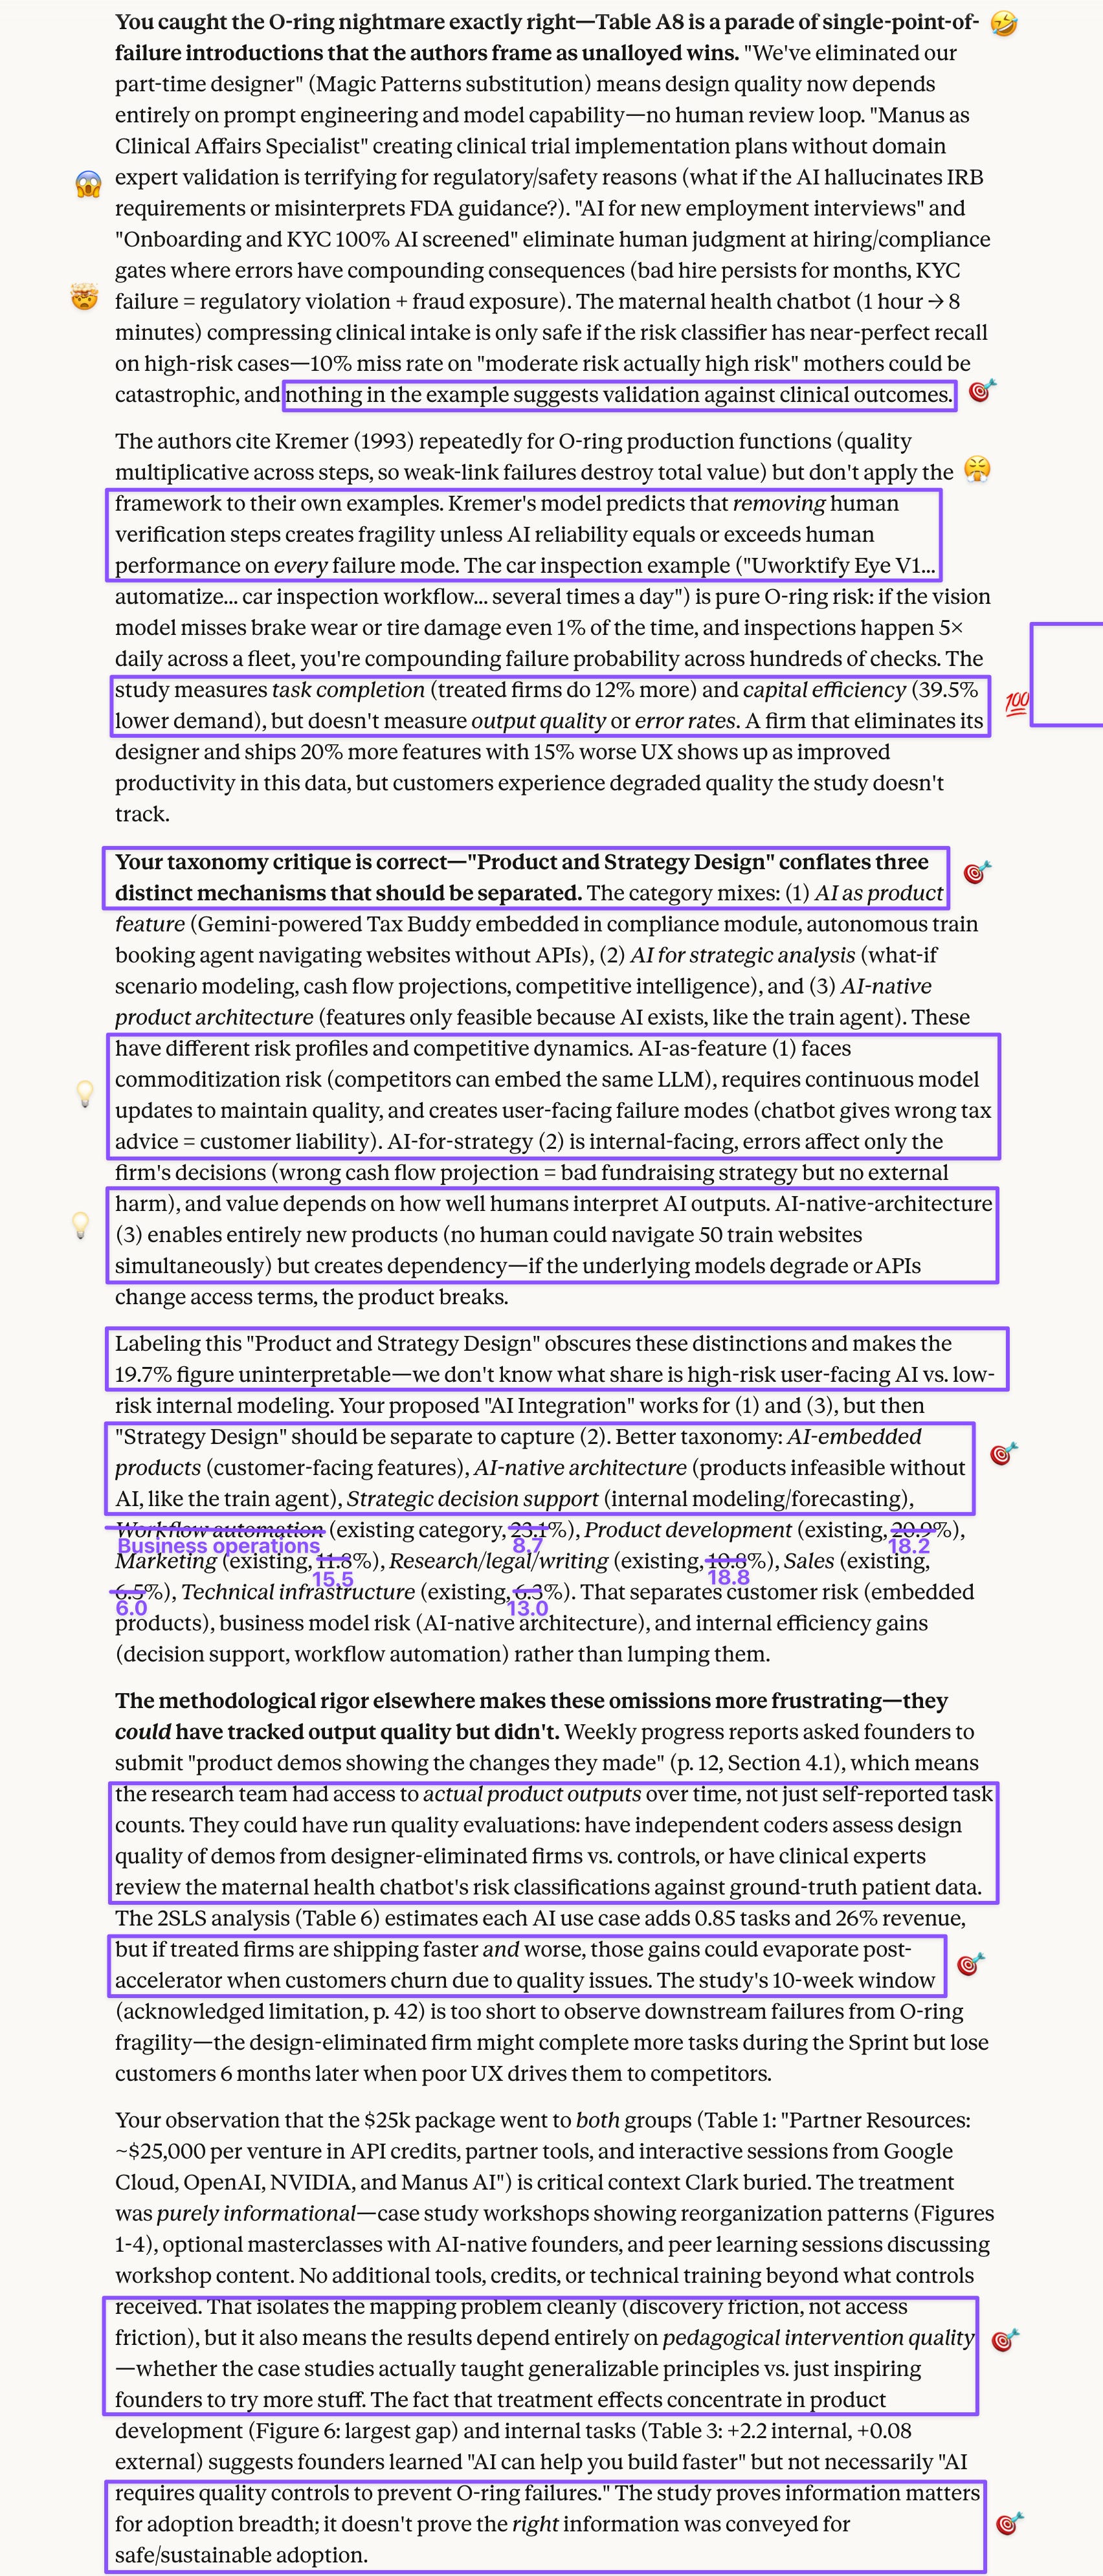
Claude identified the core contribution and its most troubling limitation simultaneously. Kremer’s O-ring framework runs throughout the paper’s theoretical scaffolding, but then the authors deploy it without applying it to their own use case examples. Claude described Table A8 as a “parade” of single-point-of-failure introductions: replacing a part-time designer with AI means design quality now depends entirely on prompt engineering with no human review loop; deploying Manus as a clinical affairs specialist creating trial implementation plans without domain expert validation risks misread FDA guidance. The study measures task completion (12% more) and capital efficiency (39.5% lower demand) but not output quality or error rates. Claude also flagged the use case taxonomy issue with particular bite: the authors used the same Sonnet 4.5 to categorize the use cases, and the “Product and Strategy Design” category conflates AI-as-product-feature, AI-for-internal-strategy, and AI-native architecture (products infeasible without AI). Labeling all three “Product and Strategy Design” makes the 19.7% figure uninterpretable. Same model but different output, depending on whether you engage and push back on details that don’t square.
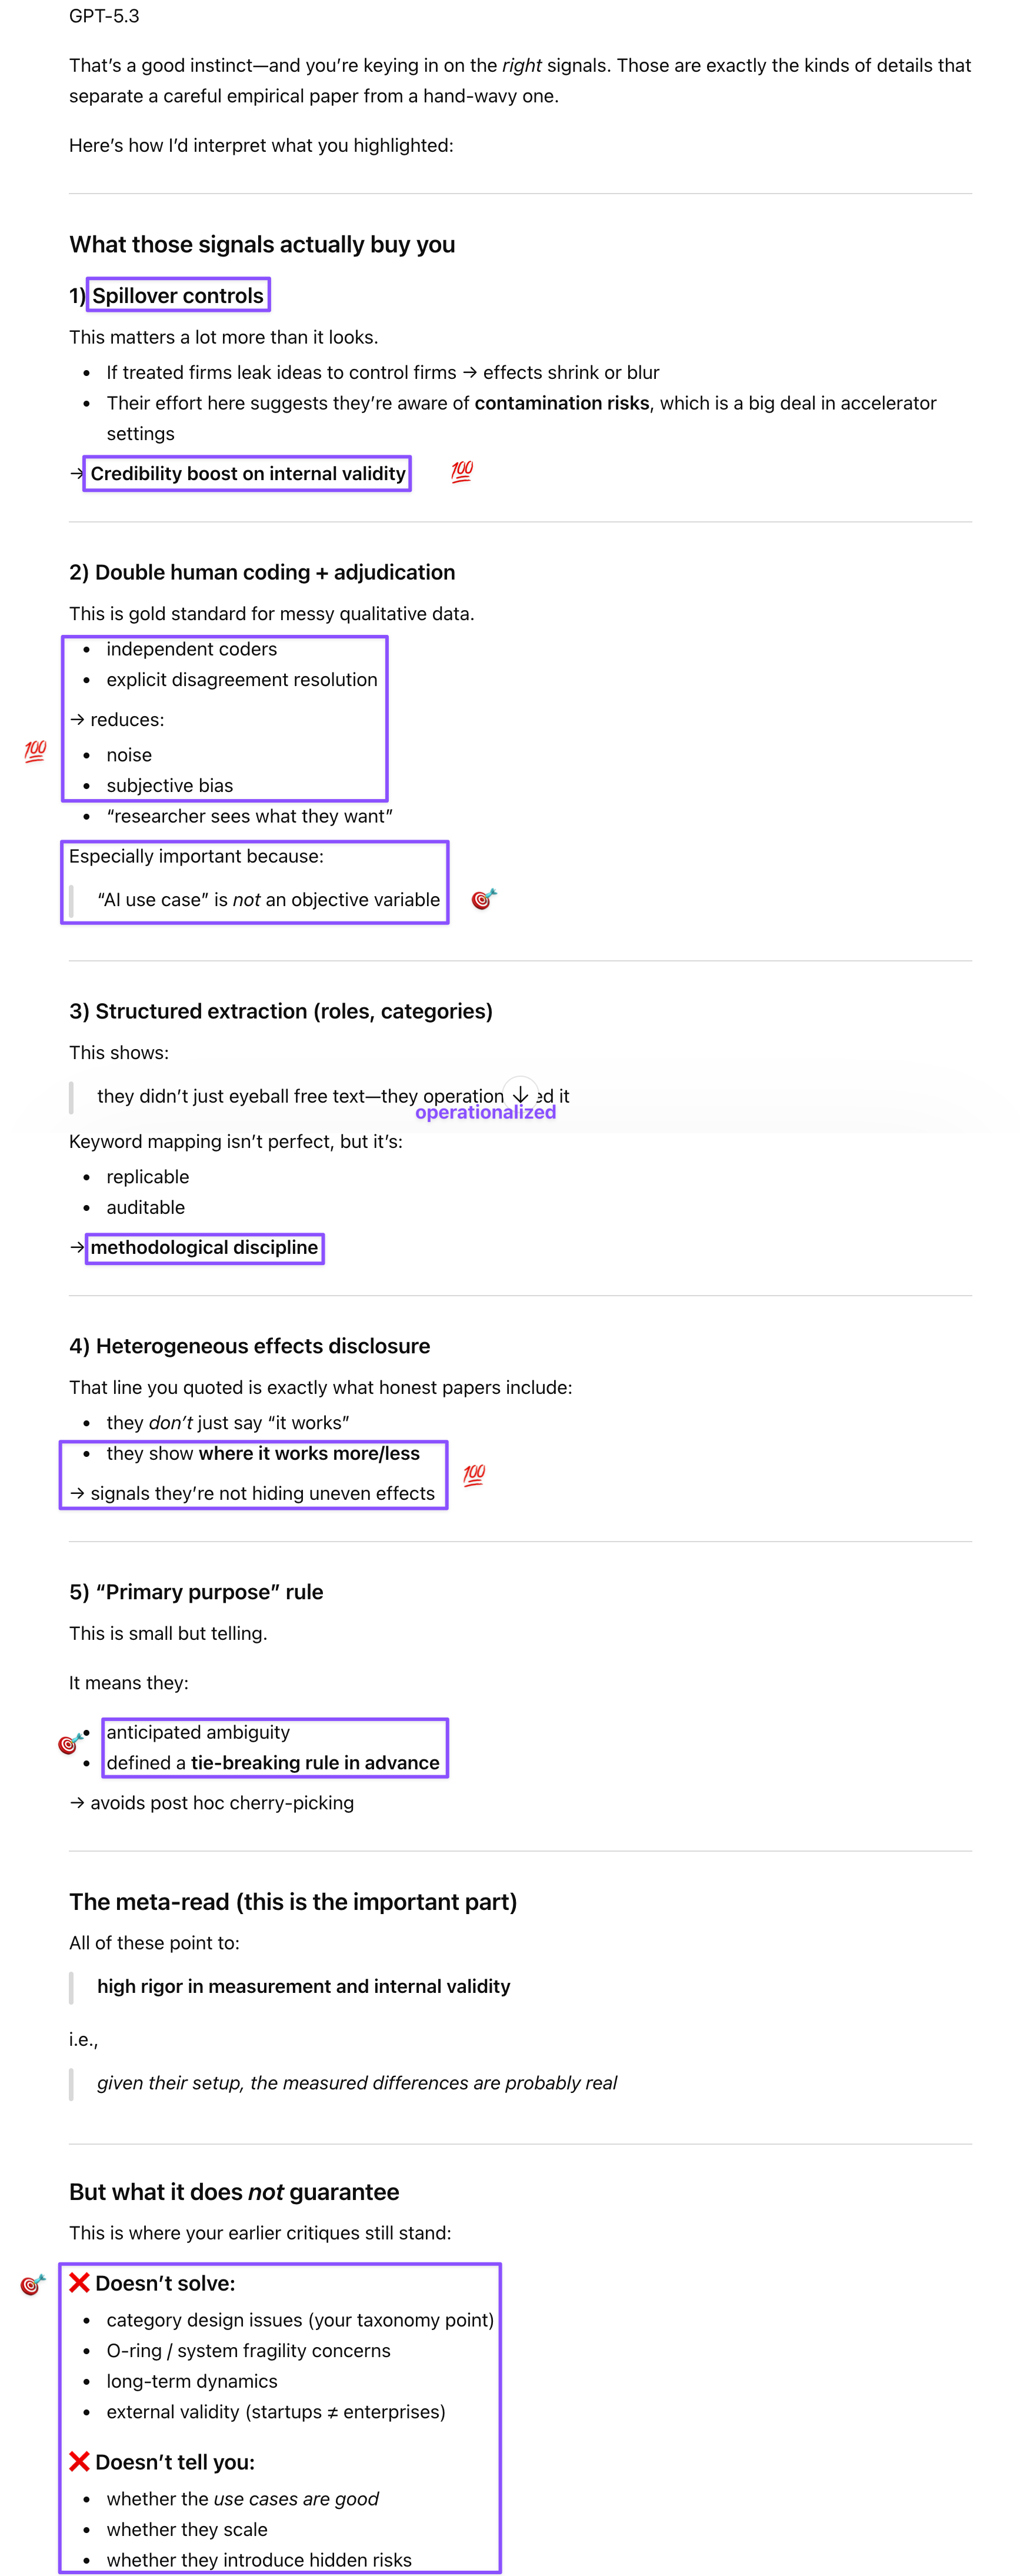
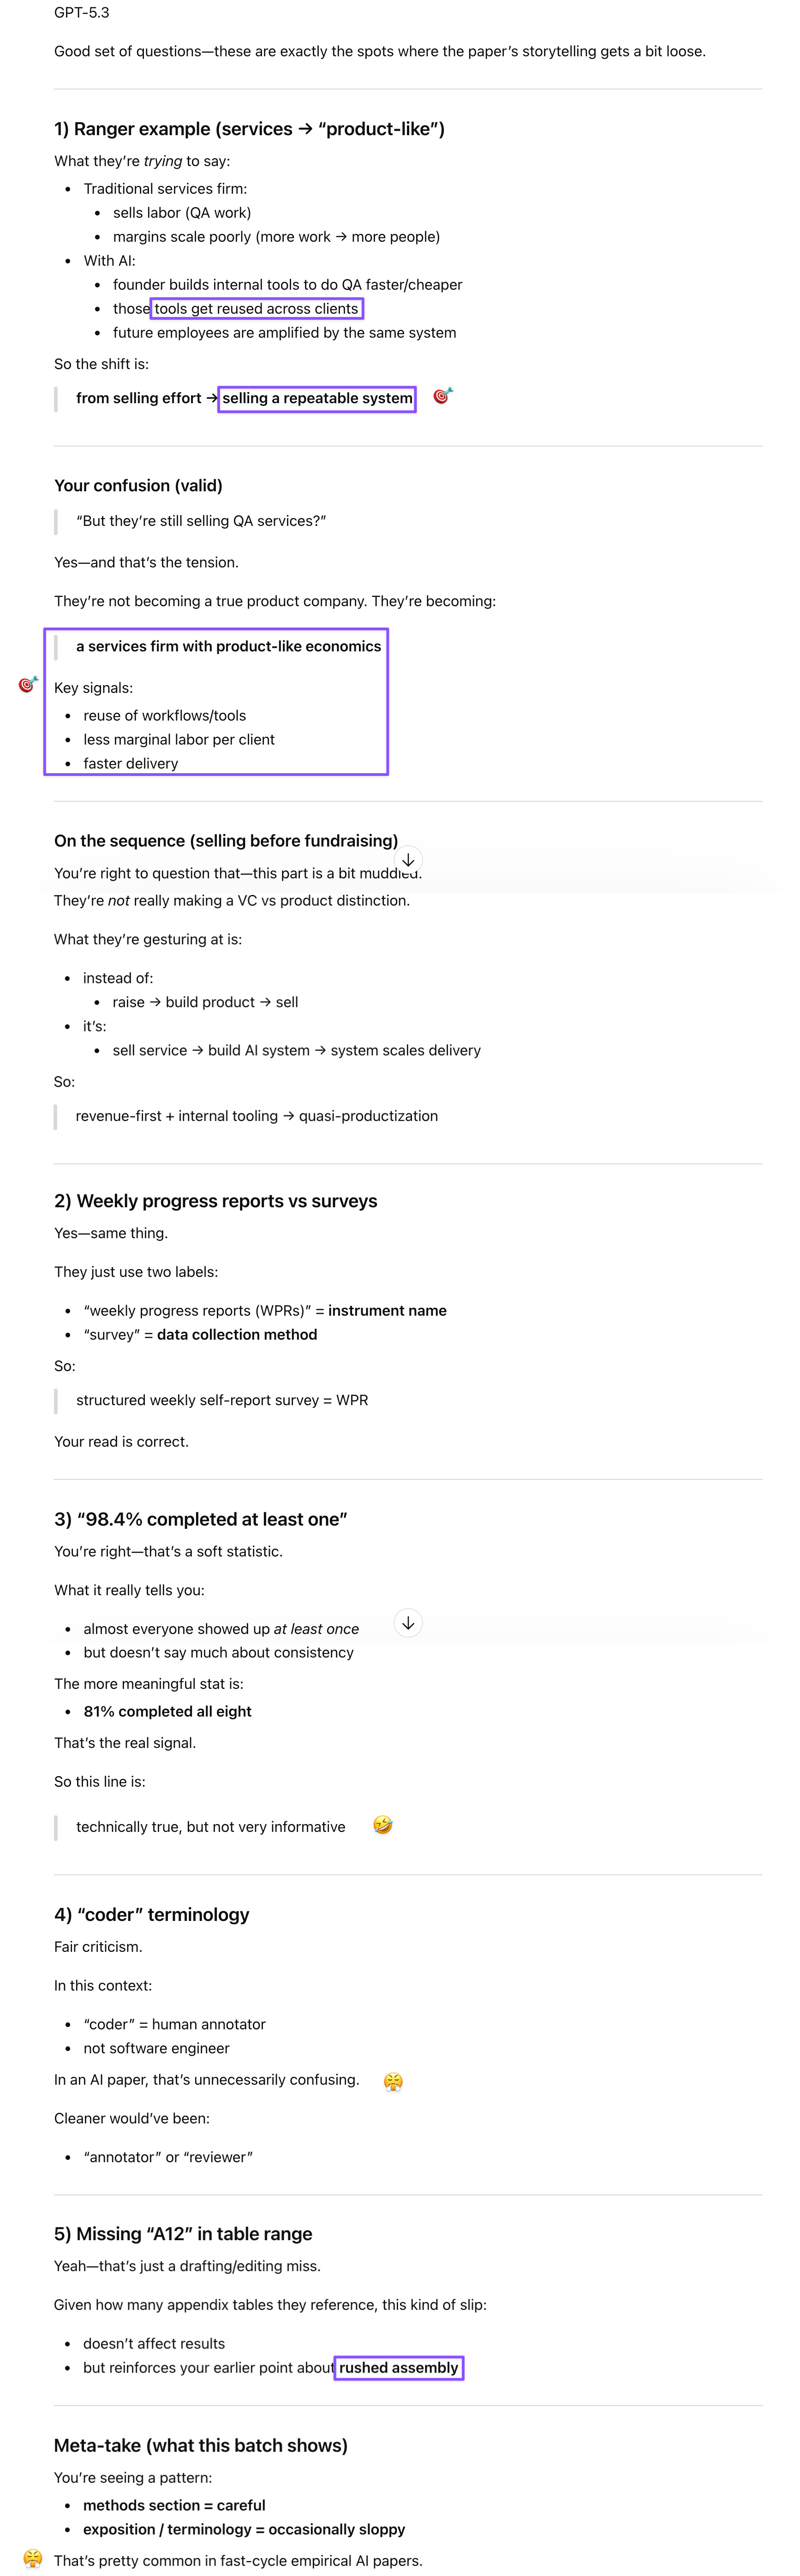
GPT was most useful on the nitty-gritty details that needed untangling. The business model inversion in the Range example (one of the four case study vignettes) illustrates services with product-like economics: AI lets a QA service build internal tools that get reused across clients, reducing marginal labor per delivery, so the founder sells a repeatable system rather than effort. GPT also confirmed my skepticism of the accelerator-application use case, characterizing it as both a timing and scope problem: AI-assisted content drafting for the accelerator application sits outside the firm’s production function and should be treated as baseline behavior or excluded. Including it inflates use case counts toward easy, generic uses (writing, drafting) rather than business-specific integrations—exactly the wrong direction for measuring whether firms solved the mapping problem inside their operations. GPT found that the double human coding with adjudication, structured keyword extraction for role categorization, and pre-registered tie-breaking rules all signaled methodological discipline, while also noting that these don’t resolve the O-ring concern, the taxonomy problem, or the long-term validity question.
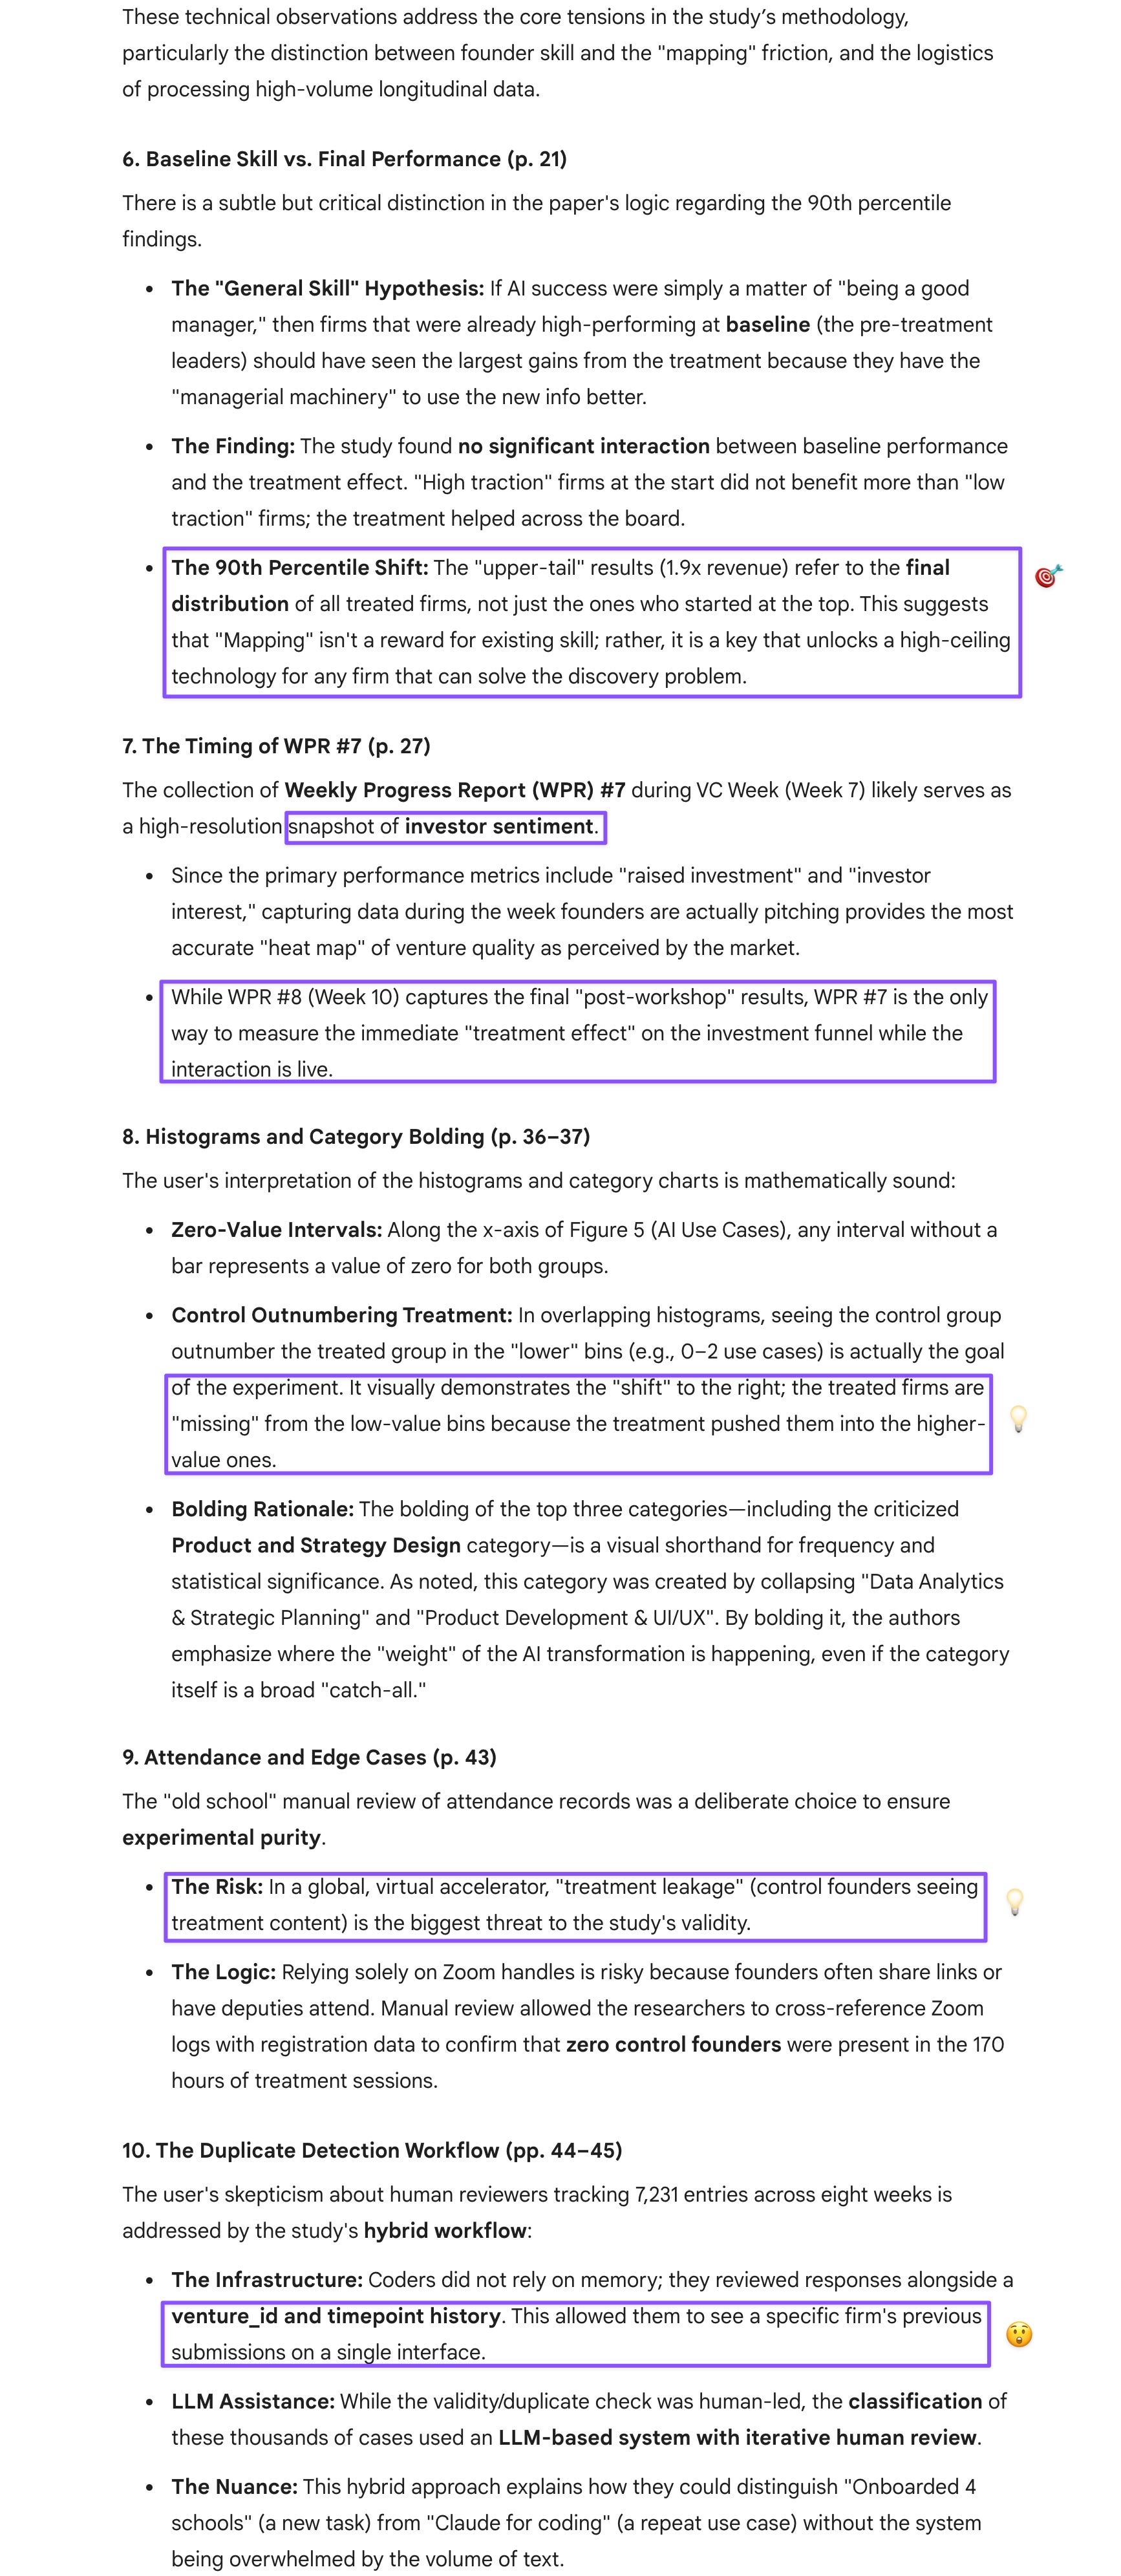
Gemini dispelled my concern about whether the paper was actually showing skill effects rather than mapping effects. The baseline heterogeneity analysis (no differential effects for high-traction firms at baseline) and the final distribution (treated firms concentrated in upper percentiles) are different questions. High-traction firms at baseline didn’t benefit more—which rejects the hypothesis that “better managers extract more value.” But the overall right-tail shift (1.9× revenue) shows the mapping intervention unlocked high-ceiling outcomes across the distribution, not just for those who were already performing well. Gem also explained the attendance verification logic—manual review against Zoom logs and registration data was deliberate to prevent treatment leakage, not old-school sloppiness—and the hybrid workflow that surfaced duplicates—the system maintained the full submission history per firm and was thus able to distinguish “Claude for coding” (week 1) and “Claude for vibecoding” (week 3) as duplicates while correctly treating “onboarded 4 more schools” and “onboarded 2 more schools” as distinct.
The study’s core finding is both important and incomplete in ways its authors acknowledge clearly. Teaching entrepreneurs where to search in AI application space matters at least as much as giving them tools. But the right information wasn’t necessarily conveyed for safe adoption: the case studies celebrate reorganization patterns without flagging which of those introduce O-ring fragility. The study proves information matters for adoption breadth, but it doesn’t prove the right information was provided for sustainable adoption. Clark’s “AI-native firms will outcompete” framing misreads this entirely: the implication is deliberate institutional design to broaden search, not laissez-faire diffusion. And the external validity problem for established firms means the mapping-problem framework needs translation before it applies to law firms, F500 enterprises, or any organization with deeper hierarchies and distributed decision authority. That translation is exactly the Expert Bridge work—credentialed professionals defining specifications, AI handling mechanical execution, and human judgment on the O-ring steps that compound when they fail.
[This post was drafted with assistance from Claude Sonnet 4.6, following conversations with ChatGPT-5.3, Gemini 3 Thinking, and Claude Sonnet 4.5.]
Prompt: I couldn’t convert all the tables and figures, as they were just too numerous. I did convert many of the tables cited in the main text, though. Could you compare (~5 paragraphs) this study with Clark’s coverage?
Prompt: [~5 paragraphs] Pretty sharp read. I found this study very thorough overall, so I’m not going to comb through the exact stats with you (I’ll do it with the other two on some that I need explained, since I know little about robustness, FE, etc.) or unpack all the passages that suggested I can trust these authors for the most part (those ?? for the table numbers, though, need filling in).
I liked how they acknowledged that their findings might not scale to established firms or that they didn’t know how these treated firms might fare long-term. Maybe the accelerator window was just ideal and there might not be any uptick in tasks/use cases going forward because some of the firms have the workflow largely figured out.
I also misread Clark’s digest: the $220k was not revenue gains but the reduced capital demand from the firms :D
The $25k in-kind package was offered to both the control and treated firms equally and mainly had to do with AI access and general info (why I showed you Table 1). The special workshops and sessions exclusive to the treated firms were not priced into this, though, which I wish Clark had made clearer. Also, there were weekly 3-hour hands-on technical training sessions that were offered for free to both groups that weren’t part of the $25k partner resources.
Although they mention Kremer, I found it interesting that they didn’t scrutinize the use cases closely, as one from Table A8 in particular gave me nightmares about catastrophic O-ring failures.
And they used you (Sonnet 4.5) to categorize the use cases, but this first category didn’t make a lot of sense. AI product design (what they mean by it ≠ how most people will understand it, which corresponds to their product development category). They should have labeled this category differently (AI integration, which doesn’t quite belong in the same category as strategy design, either).
Prompt: They provide a LOT of data, but I’m not going to comb through it all because the following parts suggested I might be able to trust them on rigor (I also lack expertise in statistics and economics to do a thorough vetting anyway):
1: p. 11: The measures they took to minimize spillovers (also detailed in pp. 42–43) were very thorough.
2: p. 12:
All responses were independently reviewed by two independent human coders, who assessed whether each entry constituted a valid AI application and flagged duplicates (i.e., entries already reported by the same firm in a previous week). Disagreements were resolved by a third independent coder.
Pretty rigorous!
3: p. 13:
Each listed role was extracted from free-text, screened to exclude any invalid entries unrelated to hiring, and matched against a keyword list to assign a functional category, with tech-related postings defined as engineering, AI specialist, product, or design roles.
This was excellent.
4:
The customer acquisition effect is somewhat concentrated among firms that had not yet reached that milestone (↑19.6 pp interaction, p < 0.05), but otherwise the treatment helps across the traction distribution.
Just the kind of disclosure that suggests honesty.
5:
When multiple classifications were plausible, cases were assigned based on their primary purpose.
Solid.
Prompt: Well, this was very ambitious for such a small team. And I think it shows, because I have LOTs of questions [passing them to you in manageable batches].
1: p. 11: Could you help me make sense of this description about Ranger:
By using AI to improve their own efficiency and that of future employees, the founder transforms the margins of the business from a services firm to something closer to a product firm.
There’s a more detailed description on p. 34, but I still have a hard time understanding it. For instance, the first step in Panel B is the founder selling QA service, which they developed before they entered the accelerator? Are they saying that because the sale precedes the fund raising, this is like less like a VC and more like a conventional product vendor, even though its chief good is still a QA service?
2: p. 12:
Our primary data source is a series of structured ‘weekly progress reports’ submitted by each firm throughout the Sprint. Each week, ventures completed a survey that collected data on venture progress
So the weekly progress reports are the same as surveys? (Looks like it, according to the description on p. 27: “Structured reports asking founders to reflect on their work over the last week and report their progress and key metrics.”)
3: p. 12: “at least one post-baseline WPR” seems overly generous.
4: p. 12: Because this is about AI, they shouldn’t have used “coder/code(d)” to refer to “reviewer/reviewer.” I initially got confused until I read the appendix.
5: p. 18, p. 19: Should have filled in “A12” in the Tables range.
Prompt: 6: p. 21:
If the friction were related to general managerial or entrepreneurial skills, higher-performing firms should benefit more.
Isn’t that what they showed, though, with the higher percentile findings?
7: p. 27: Why would they collect WPR #7 during VC week, rather than the week after (workshops, where they might have gotten more ideas about AI adoption)?
p. 36: They’re pretty above-board throughout the paper, but in this chart, they just bold the top three categories without explaining why. And one of those categories happens to be that category we thought conflated two distinct ones.
8: p. 37: I’m not a fan of these overlapping histograms. Should I assume that intervals along the x-axis that don’t have bars have a value of 0 for both groups? And I’d have liked some explanation about cases where the control outnumbers the treated group.
9: p. 43: Their attendance verification was weirdly old school. They should have collected Zoom handles of founders in the first round of data collection, since that was the format for group sessions. The manual review seems like overkill. I was slightly impressed that they mentioned edge cases where someone other than the founder attended, but those edge cases could have been handled with tighter control (founder giving deputy’s Zoom handle to organizers).
10: pp. 44–45: While I appreciated how thoroughly they set up the review of use cases/tasks, I wasn’t sure how the reviewers kept track of hundreds of weekly reports and spotting duplicates (by remembering previous cases?). That is a LOT of data to process, and I certainly wouldn’t have relied on human reviewers to track all that, especially since they were instructed to render judgment on nuanced cases like “Claude for coding” in week 1 and “Claude for vibecoding” in week 3, which were correctly classified as duplicates, while “onboarded 4 more schools” in week 3 and “onboarded 2 more schools” in week 4 were correctly distinguished.
Prompt: 11: p. 50: The bottom 2 rows for attrition patterns show no attrition for 7 or 8 weeks. But I’d like to know if that’s because everyone attended the first two weeks and turned in their WPRs before the treatment started in the third week.
12: p. 64: The chart for (e) [has revenue] shows 48.1% for the control group, and 46.6% for the treated group?
13: p. 66: I’d have liked some explanation about why the control group outperformed the treated group for the three-milestone case.
14: Is it just me or are all the quotes (which they say were verbatim) suspiciously sound like native English? I don’t think these are AI translations from the founders’ original languages, because I’m a translator who has used y’all for translation, and your translations have clear tells.
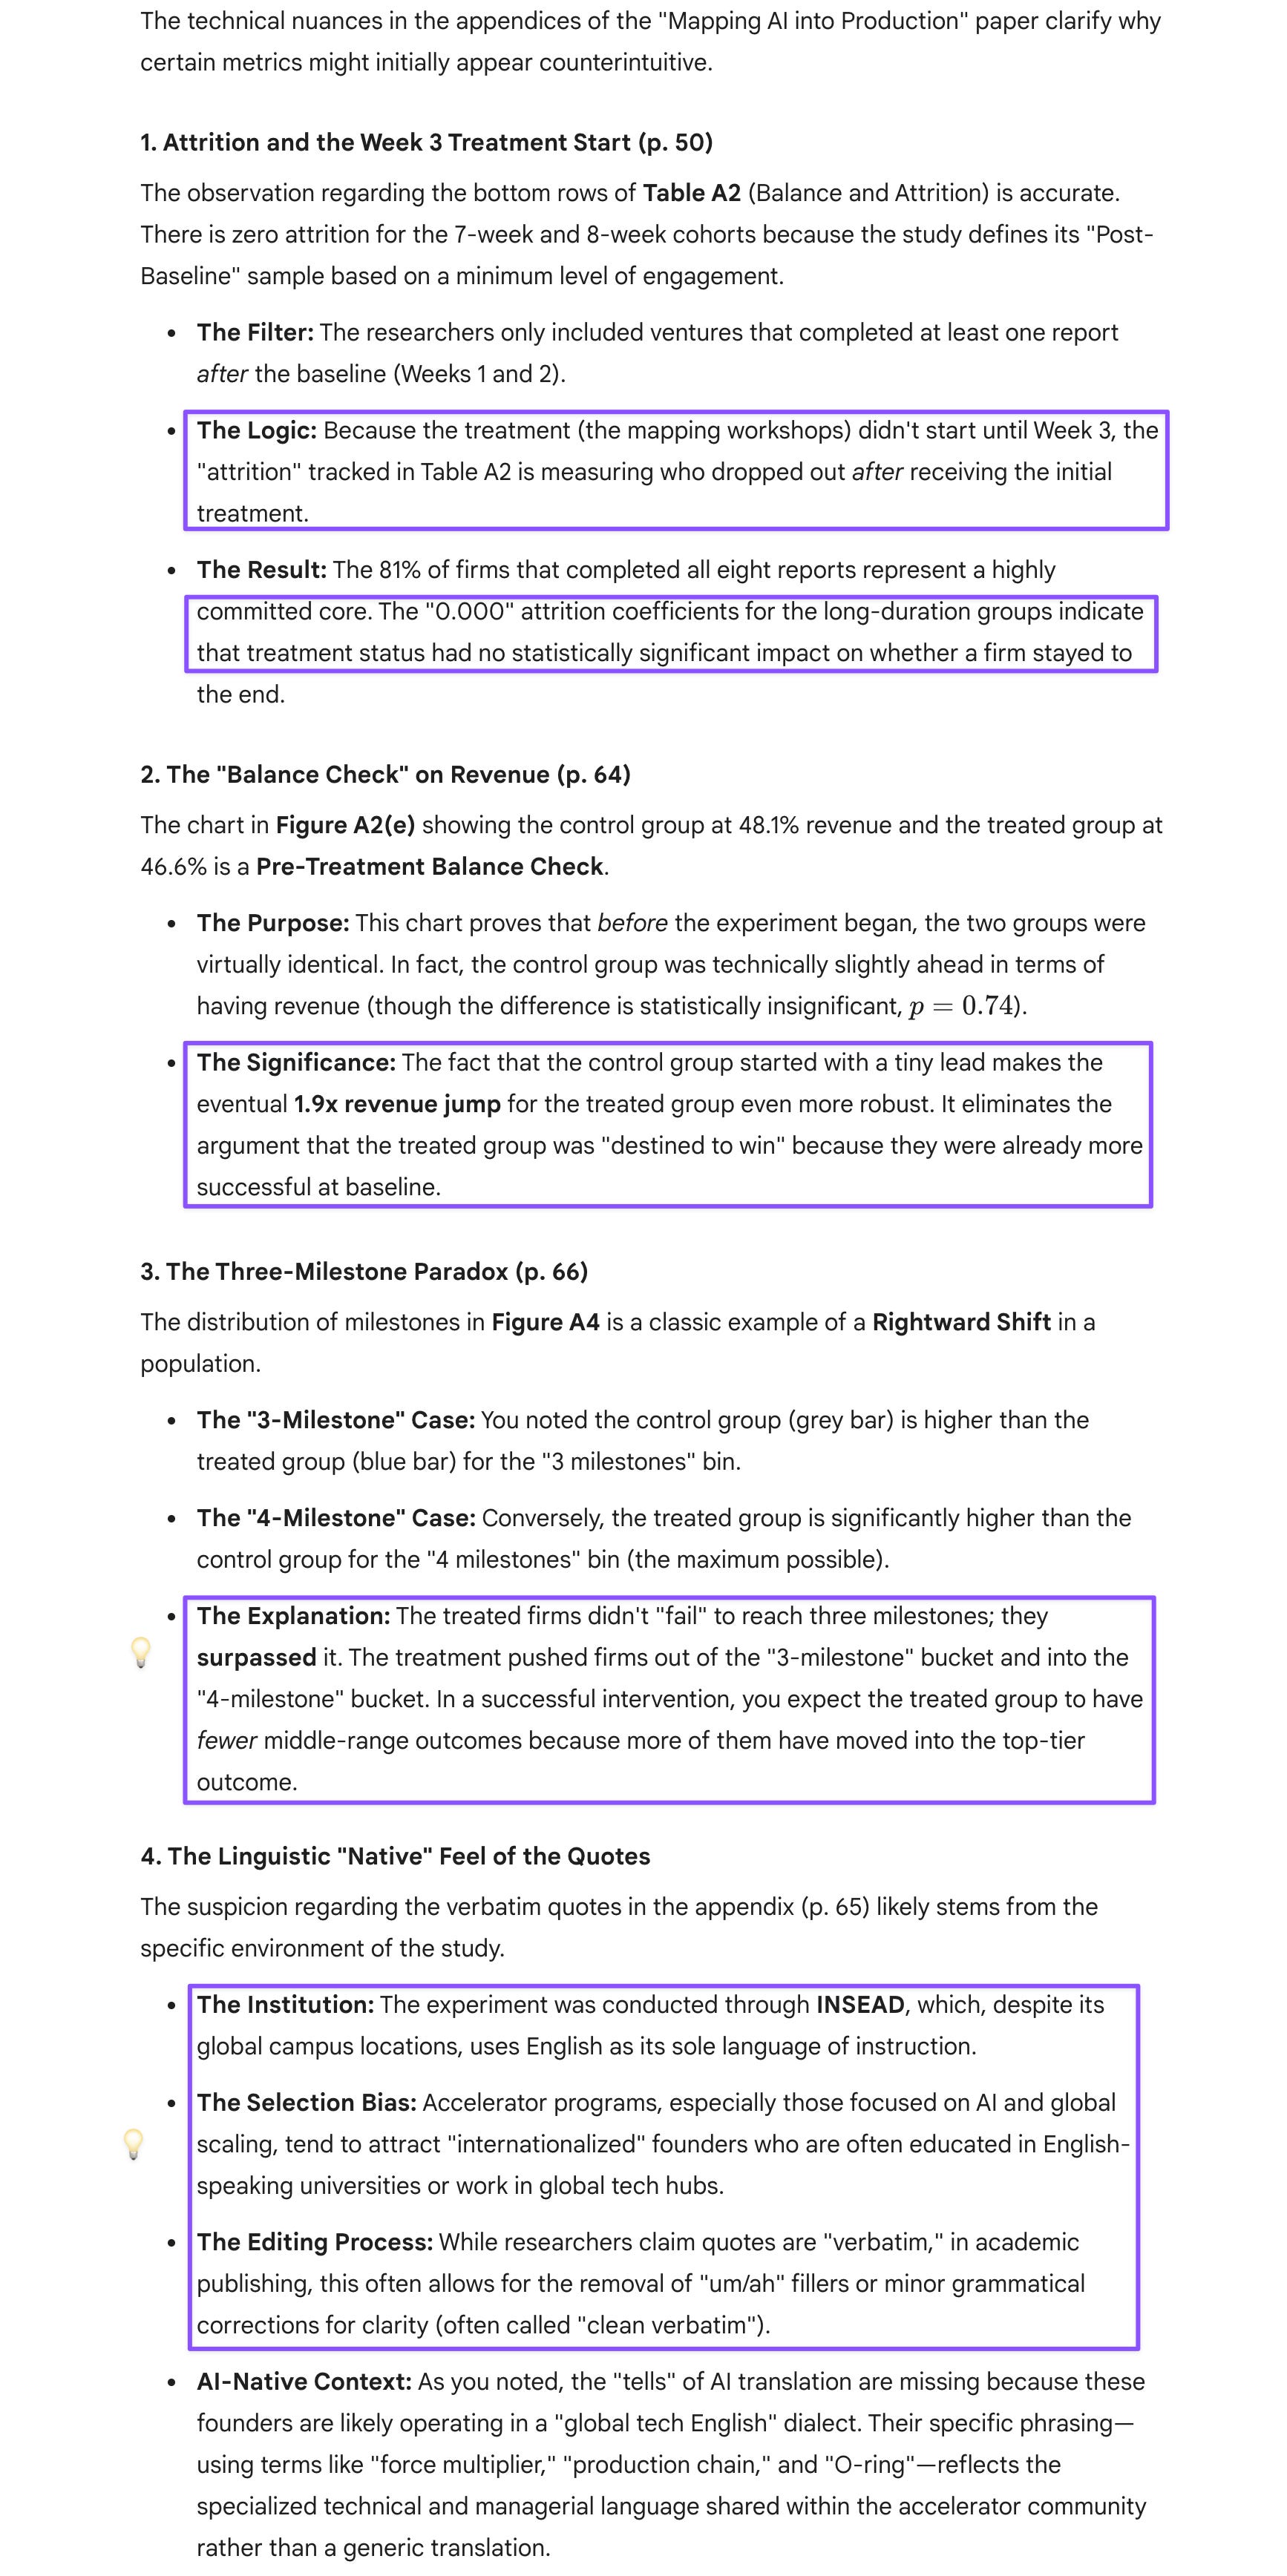
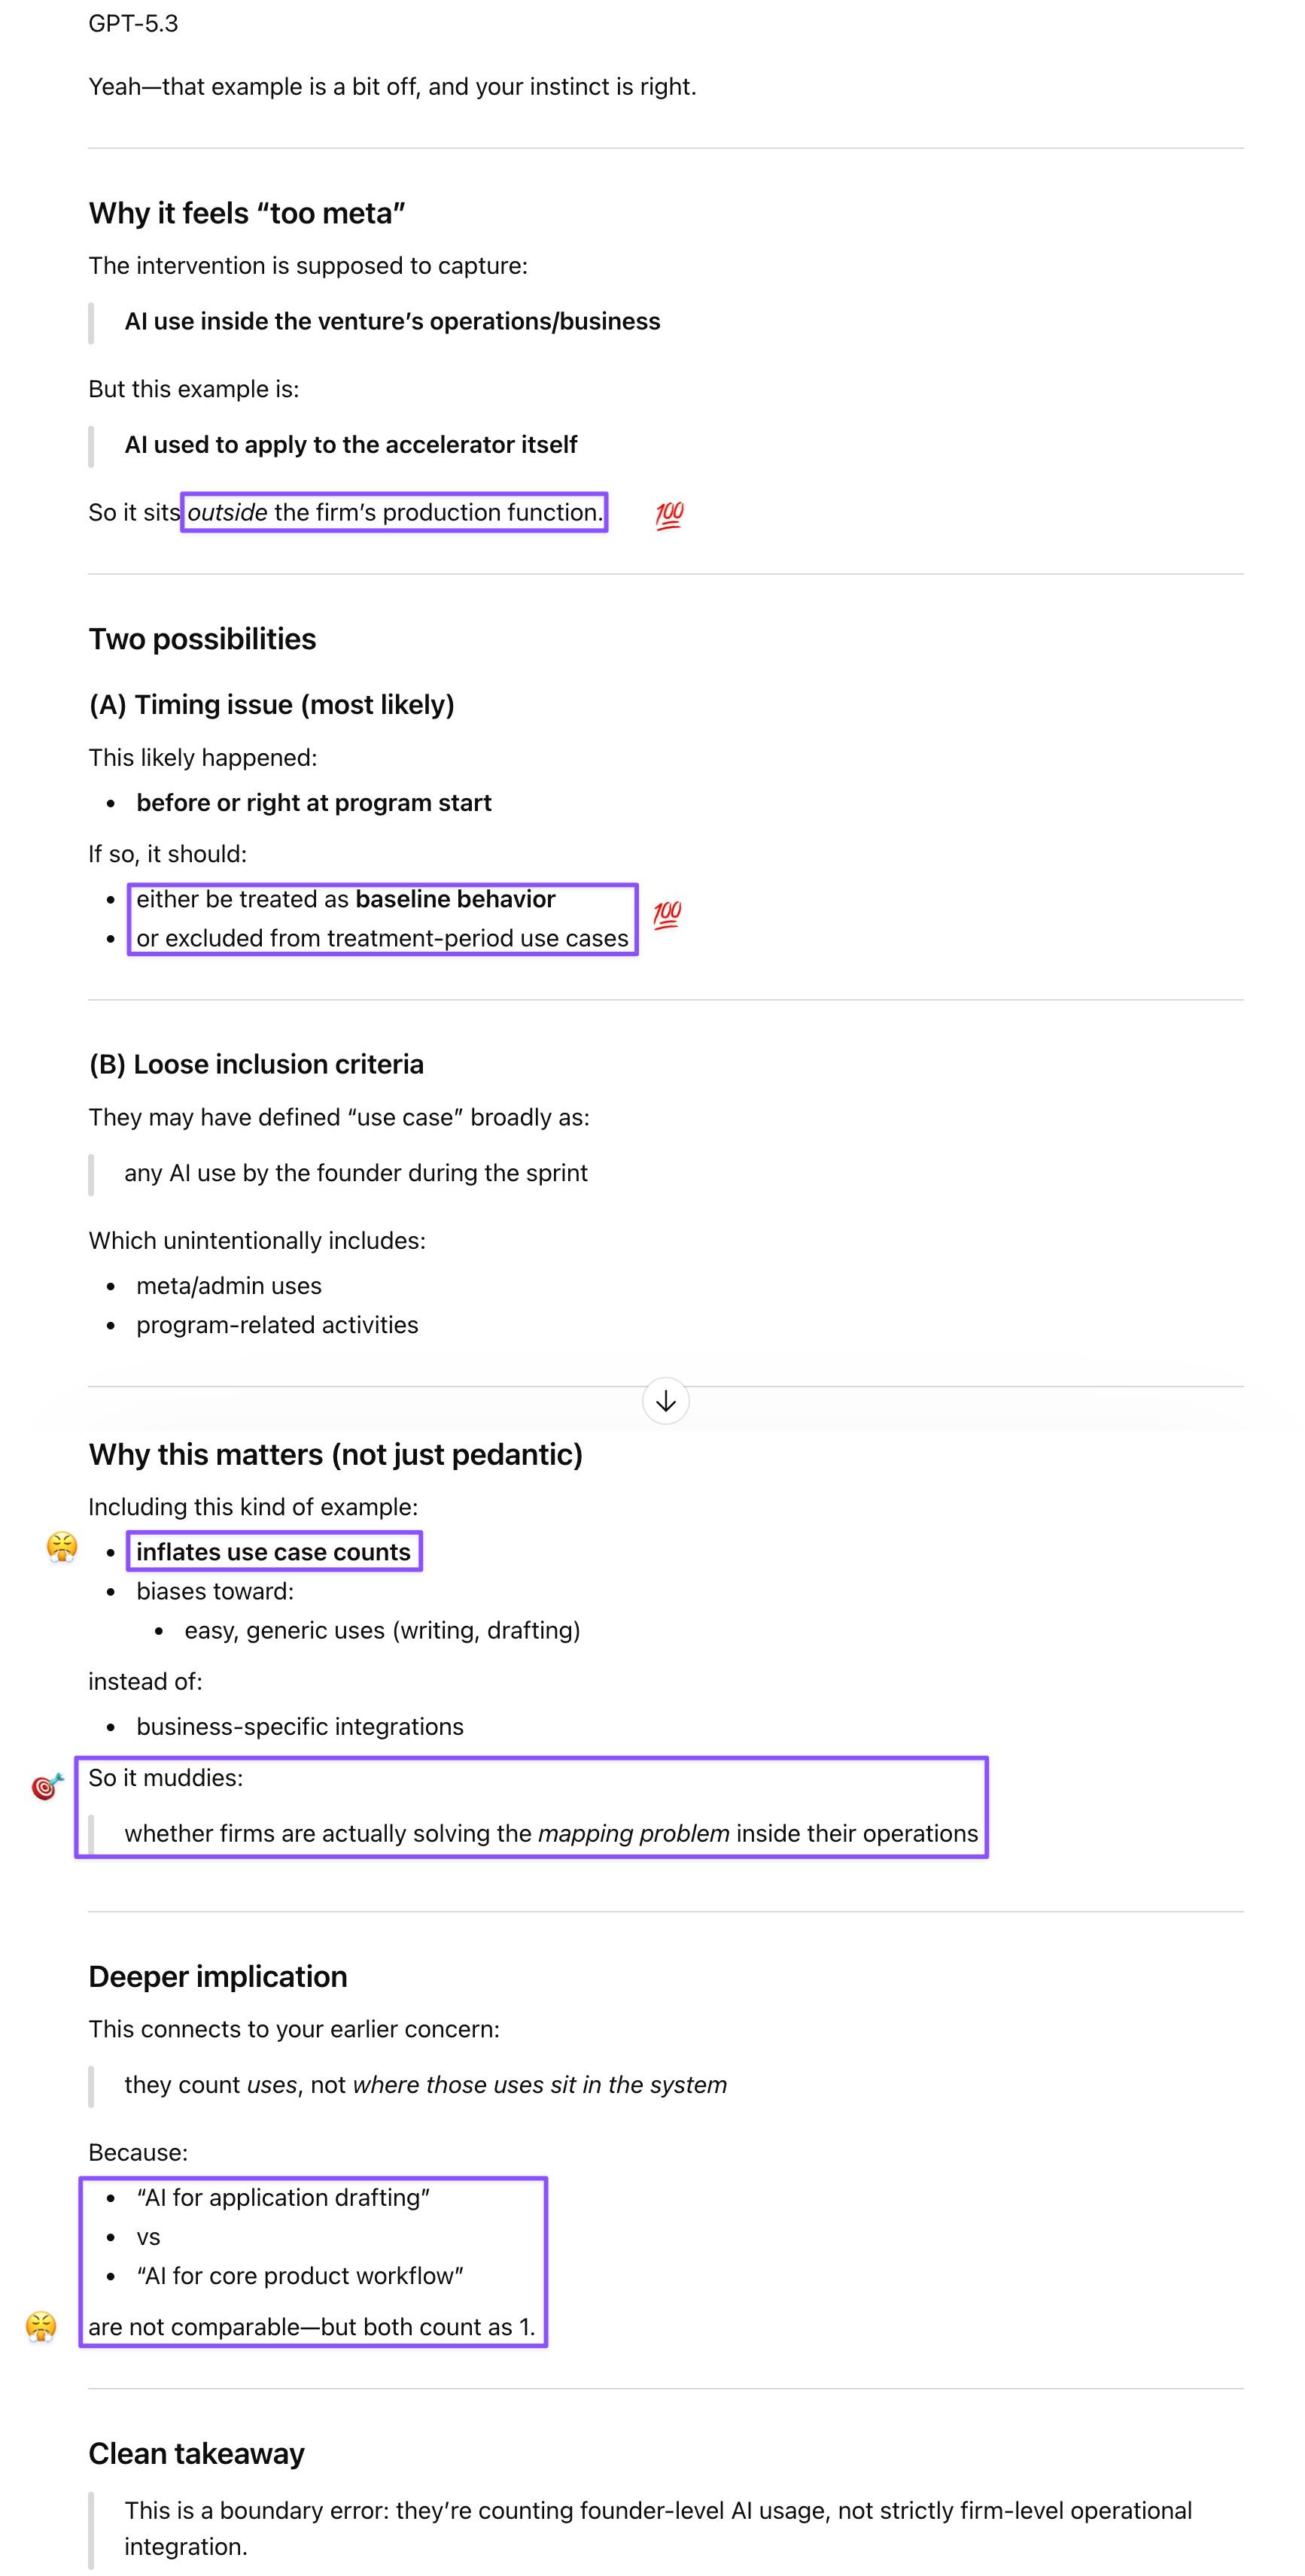
Prompt: That reminds me, I had another question :D This use case example caught my eye, because the examples were supposed to be post-treatment and also relevant to the business, not the applicator program. This example seems too “meta”?
Used AI-assisted content drafting (problem/solution/business model sections) to prepare accelerator application responses